
Visualisation of flow calculations
The major providers of flow simulation software, such as Ansys Fluent, Ansys CFX, Simcenter Star CCM+, FLOW-3D® oder Simerics MP+ each offer in-program options for evaluating and visualising simulation results.
In our company, the engineers also use different software for flow calculations, depending on the application. For the visualisation of the results, however, we mostly use only 1 product – and this has been the case for many years: FieldView.
What we appreciate about FieldView is the ease of use, the high degree of automation when comparing calculation results of geometry and case variants, the enormous number of interfaces to commercial and non-commercial flow simulation programmes and the handling of large and very large amounts of data in client-server mode.
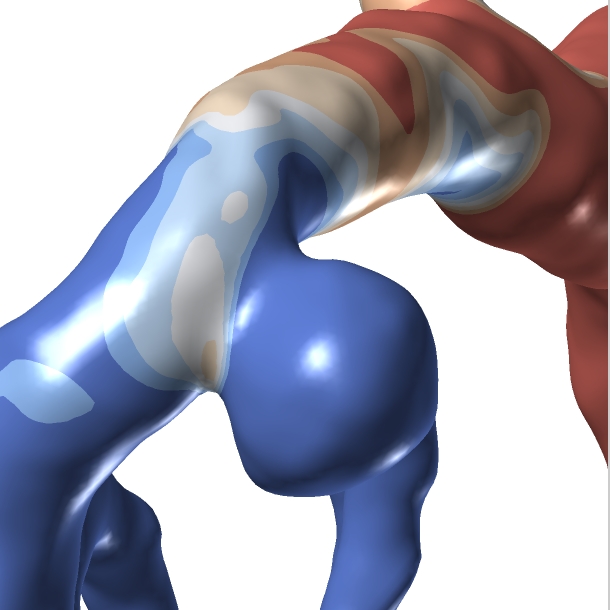
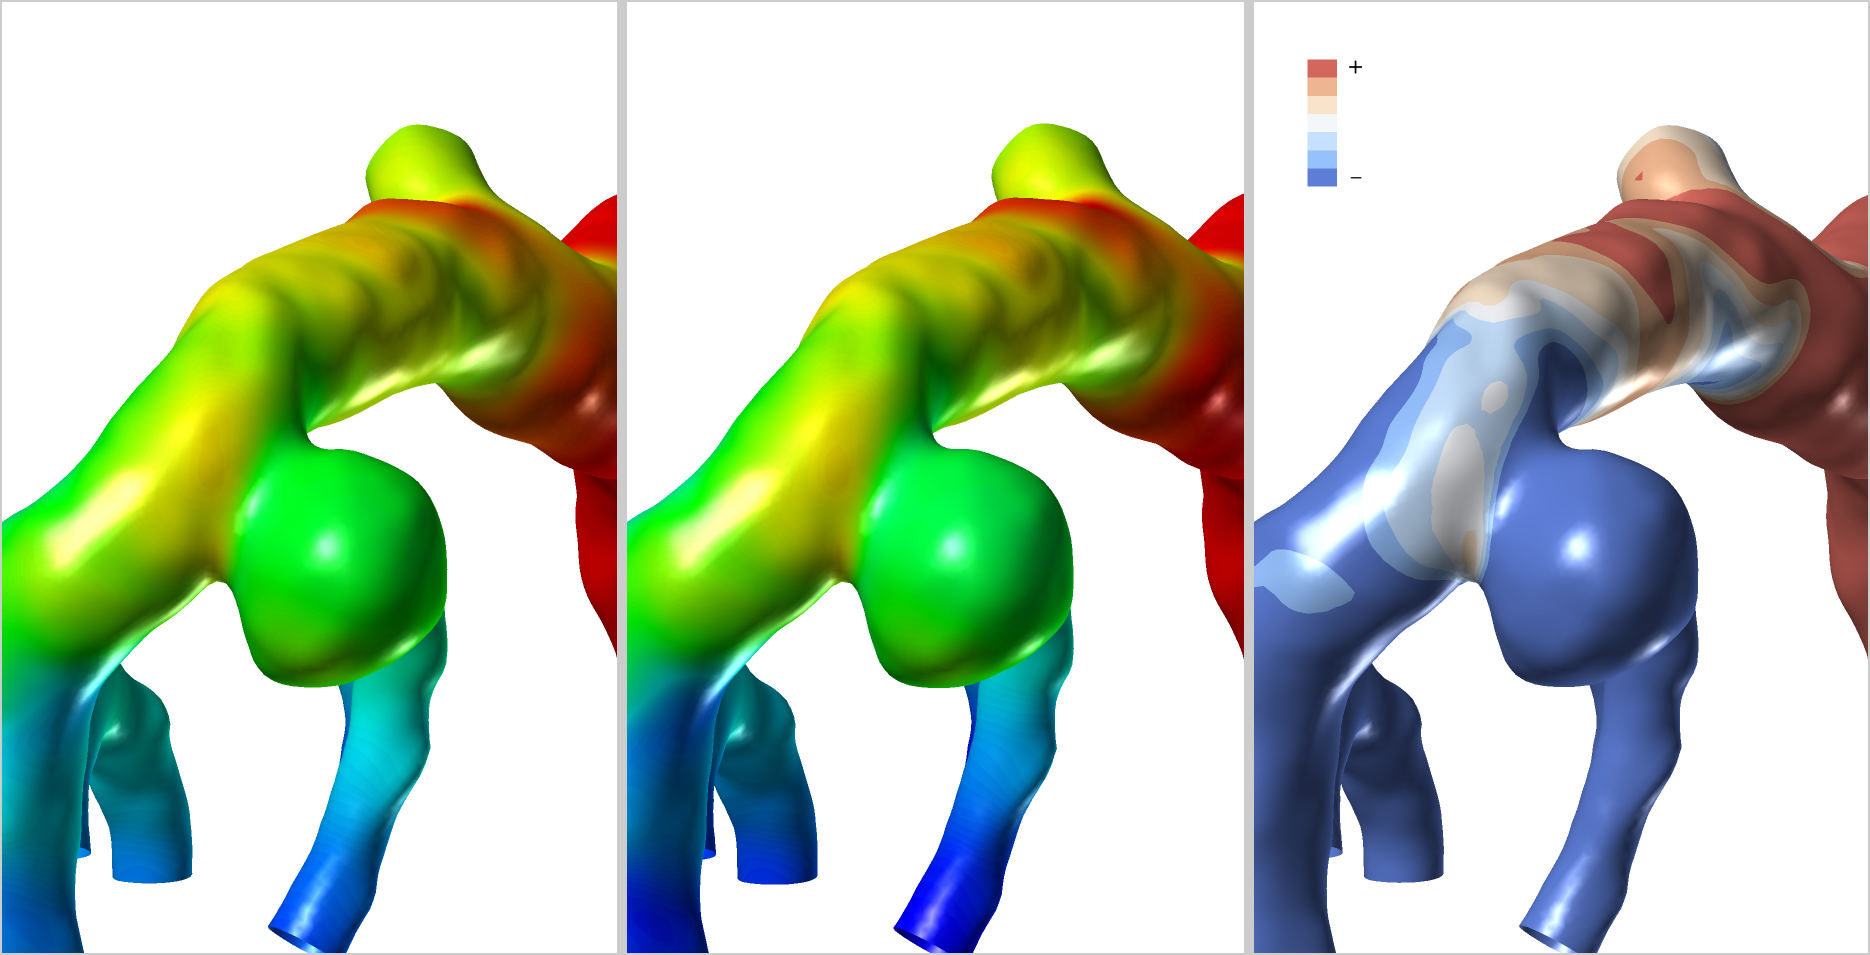
An example: The first two pictures show two variants of the flow through an aneurysm in a blood vessel. Differences in pressure are difficult to see. If you use the “Dataset Comparison” feature to compare the pressure in image 2 with the pressure in image 1, the existing pressure differences can be elegantly visualised (red: higher pressure, grey: identical pressure, blue: lower pressure).
Visualisation with FieldView
The automation of repetitive tasks is also very conveniently solved by restart files and – if required – the script language FVX. Visualisations can thus actually be created with a click of the mouse.
Thanks to comprehensive downward compatibility, result files and self programmed routines can still be read into the latest FieldView version without any problems, even after many years. And the development of FieldView continues: one focus is on processing the enormous amounts of data that arise due to the rapidly growing hardware performance in three-dimensional flow calculations – Big data!